Compensation Plan Simulator
Model direct-selling comp plan changes in real time before rolling them out
Video Demo
El Problema
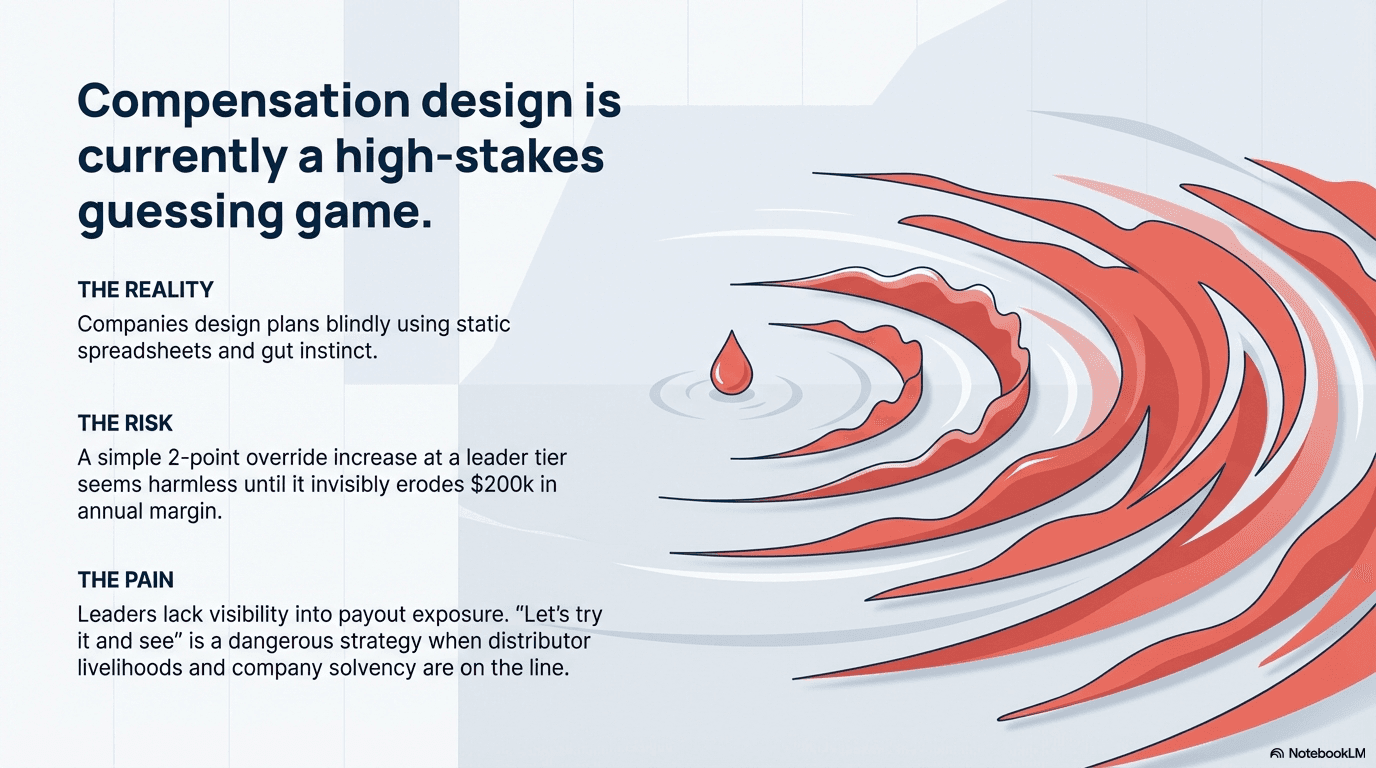
Direct-selling companies live and die by their compensation plan, yet most design changes with spreadsheets and gut instinct. A 2-point override increase at the leader tier might sound harmless until it erodes $200K in annual margin — and nobody sees the ripple effects until it's too late.
La Solución
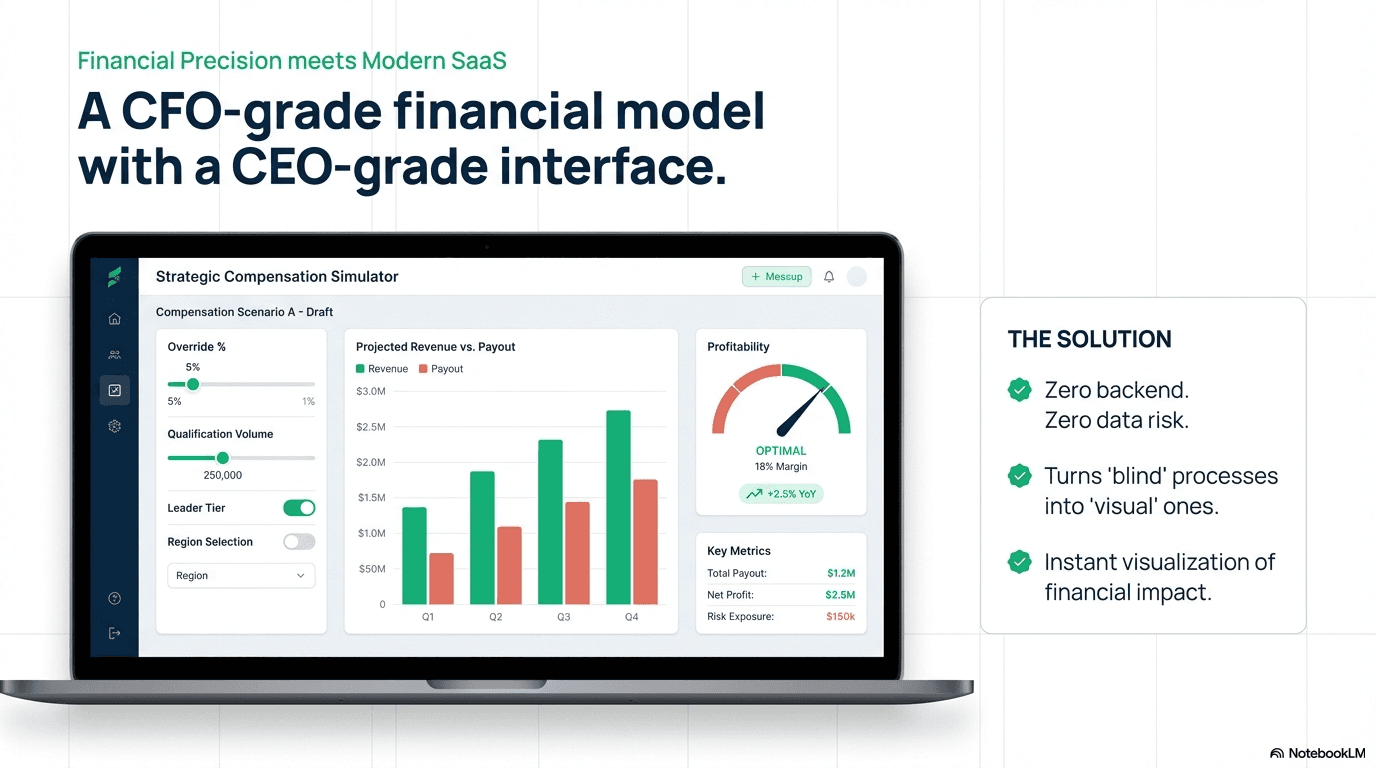
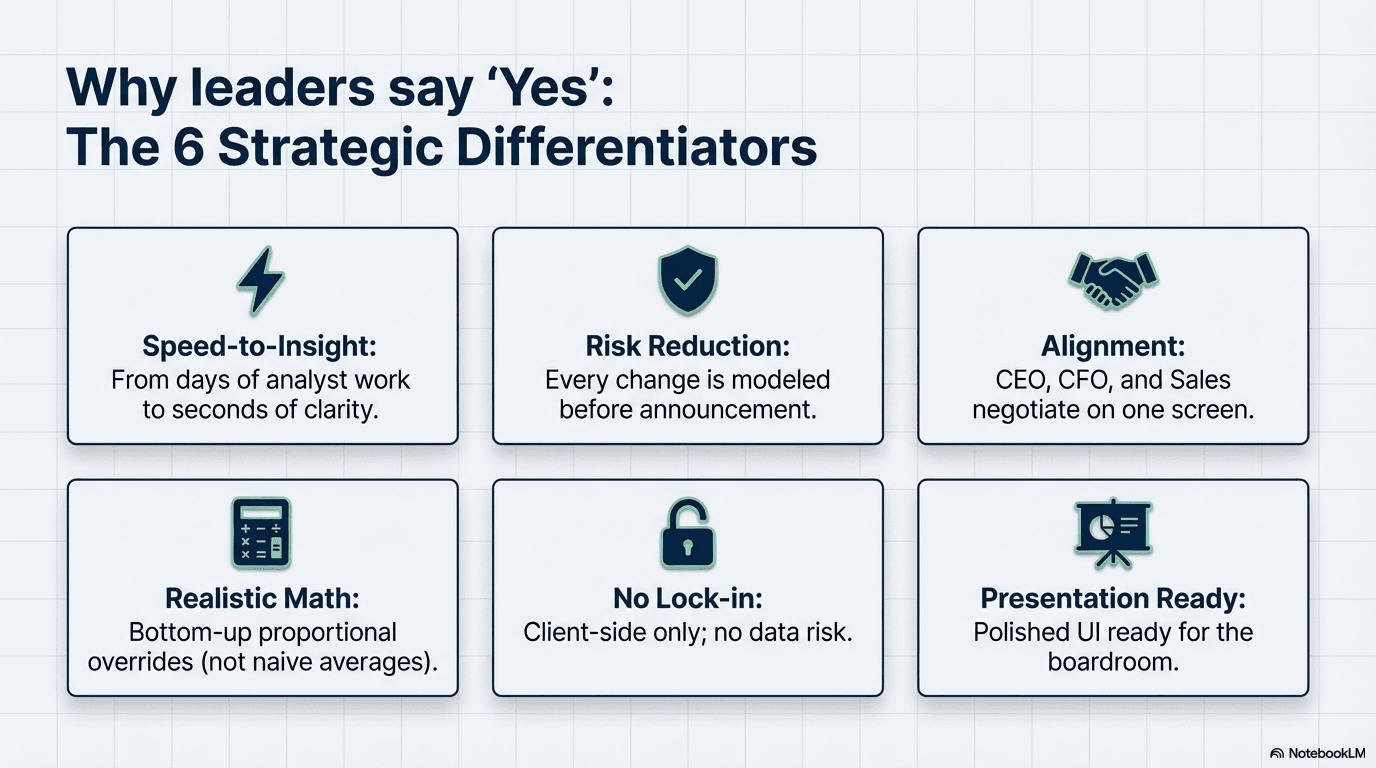
A fully interactive client-side simulator that lets operations leaders configure two compensation plans side-by-side across 45 inputs and see instant financial impact via KPI dashboards, revenue waterfalls, payout distributions, and break-even curves — all shareable via URL with zero backend.
Características Principales
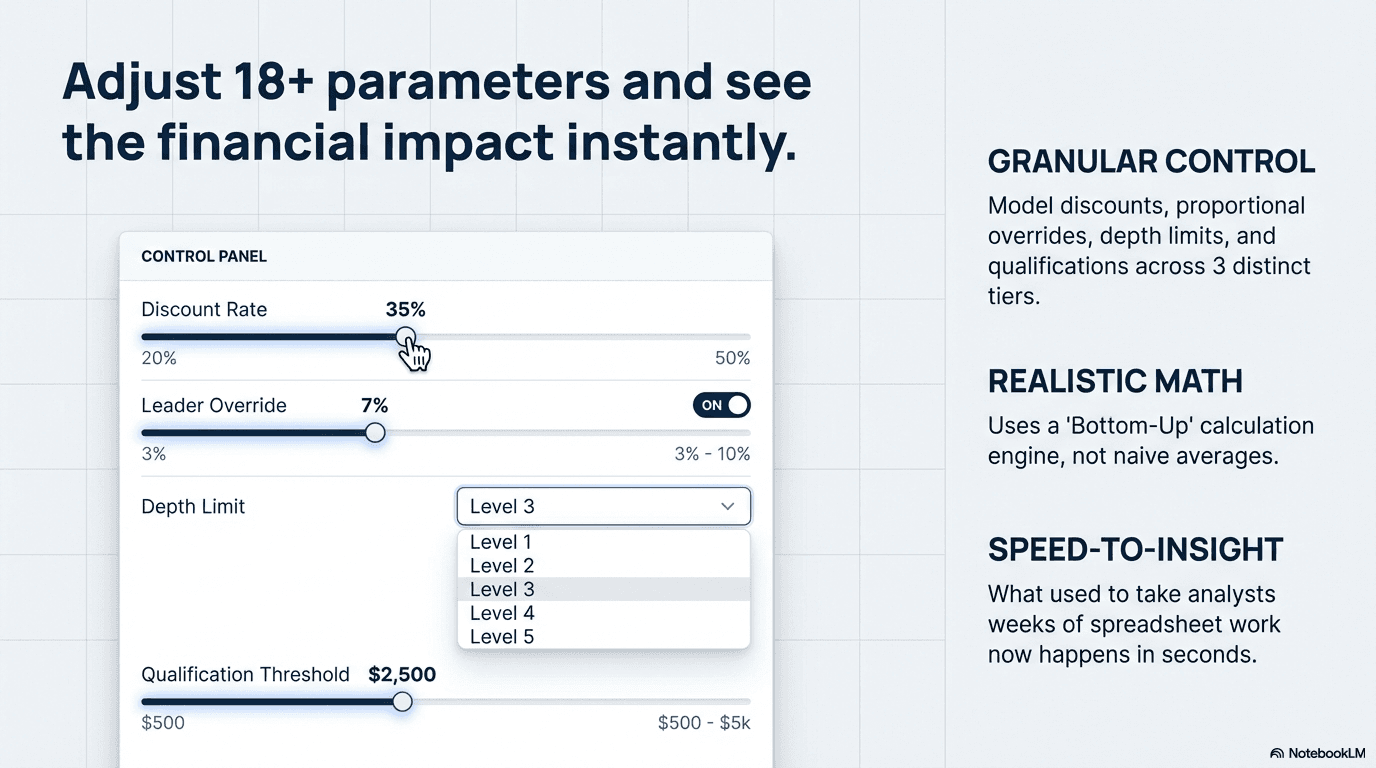
- 45 interactive inputs (18 per plan x 2 + 9 network params) with real-time financial recalculation
- Side-by-side Current vs Proposed comparison with 6 KPIs, dollar deltas, and percentage deltas
- Revenue waterfall, payout distribution, and break-even crossover charts via Recharts
- Shareable URL state encoding — full scenario compressed into a link for team review
- Full EN/ES bilingual support with dark/light themes and 4 built-in scenario presets
Resultados
Overview
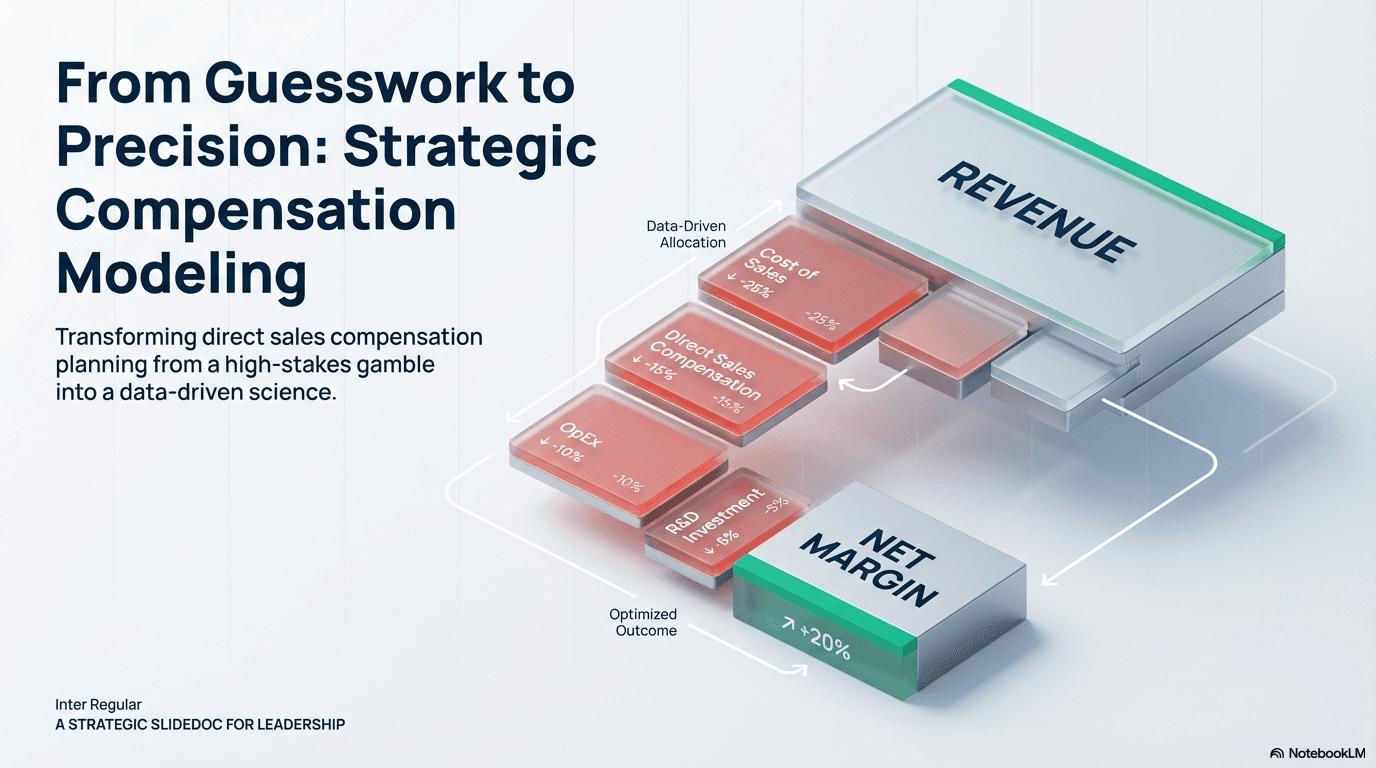
Compensation plan changes in direct-selling companies are high-stakes decisions that affect company margins, distributor earnings, and field retention — yet most companies design them with spreadsheets, gut instinct, or expensive consultants, with no way to see the financial ripple effects before going live.
This simulator turns a blind, slow, high-risk process into a visual, instant, reversible one. Operations leaders adjust commission rates, override percentages, and network parameters, then see real-time financial impact across KPIs, waterfall charts, and break-even curves.
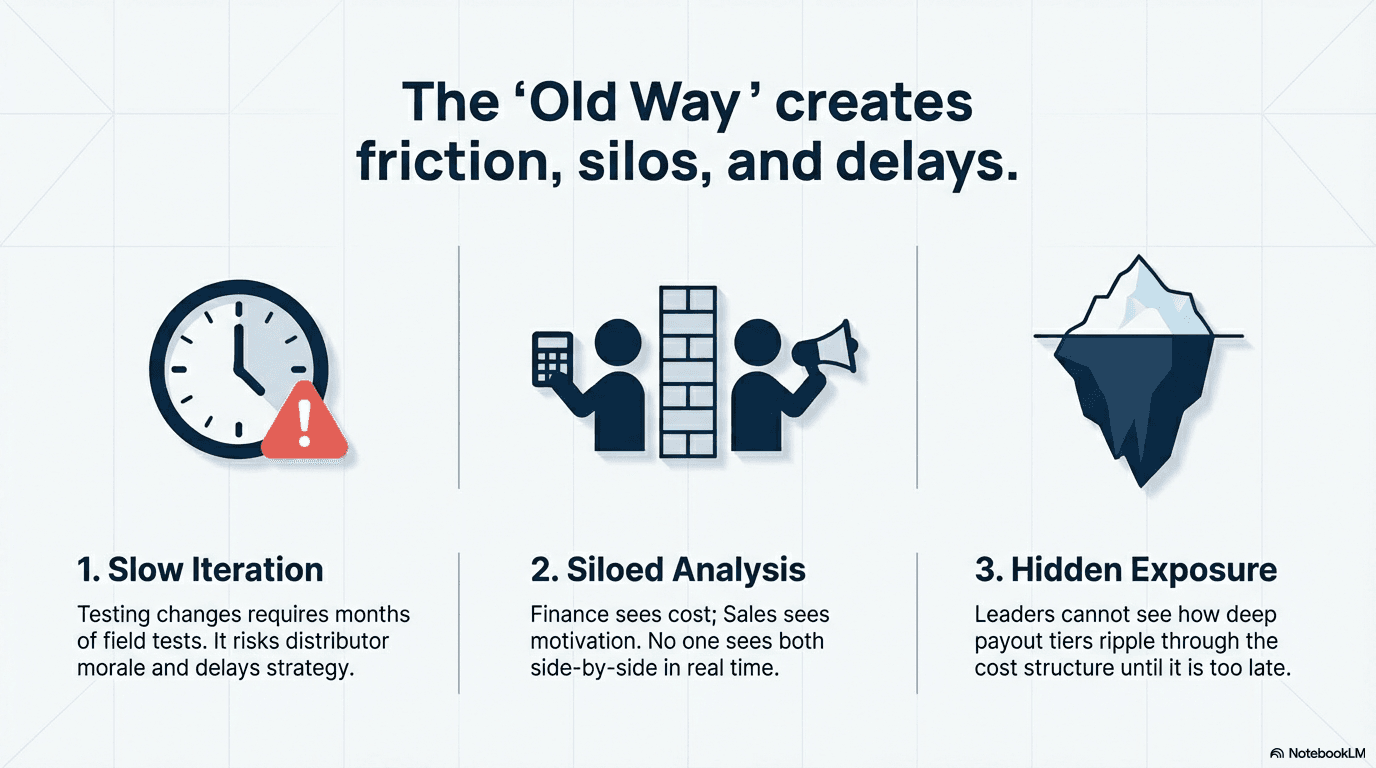
The Challenge
- No visibility into payout exposure — changing one tier's override rate ripples through the entire cost structure in ways spreadsheets can't easily show
- Slow iteration cycles — testing a comp plan change in the real world takes months and risks distributor morale if it doesn't land
- Siloed analysis — finance sees costs, field leaders see motivation, but nobody sees both side-by-side in real time
- Cascading effects — override depth, qualification thresholds, and headcount ratios interact in non-linear ways that are impossible to reason about intuitively
The Solution
A fully interactive, client-side simulator that lets users configure two compensation plans side-by-side and see the financial impact instantly:
- Configure Tab — Adjust personal discounts, override rates, override depth, and qualification rules across 3 tiers (Consultant, Leader, Leader of Leaders)
- Financial Dashboard — 6 real-time KPIs: total revenue, total payout, company margin, margin %, avg consultant payout, avg leader payout — with delta indicators
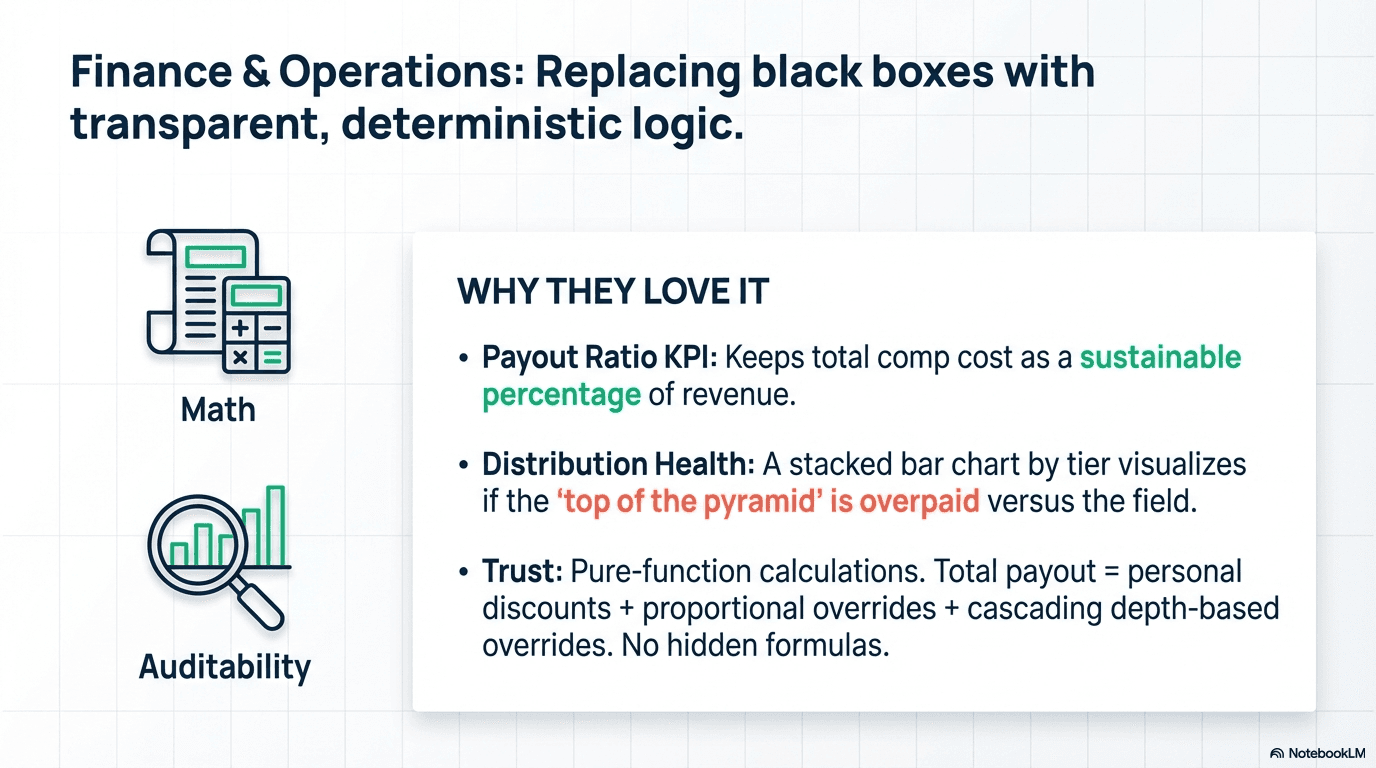
- Revenue Waterfall — Stacked waterfall chart showing gross revenue through discounts, overrides, down to net margin
- Break-Even Analysis — Line chart plotting current vs. proposed cost curves at up to 3x volume with crossover point detection
- Comparison Table — Side-by-side metrics with dollar deltas, percentage deltas, and color-coded indicators
- 4 Presets — Default, Aggressive Overrides, Flat Structure, High Growth scenarios
- Shareable Links — Full state compressed and encoded in URL for team review
Technical Highlights
- Zero backend — all calculations run client-side as pure functions, easily testable with no React dependencies
- Zustand state management handles ~5 interdependent state groups without excessive re-renders
- URL state encoding — full configuration compressed with lz-string into a
?s=query param via debouncedhistory.replaceState - Break-even crossover detection — iterates over 200 volume scale points to find the exact crossover
- Bilingual — full EN/ES with the same i18n pattern used across the CushLabs portfolio
- CushLabs design system — Space Grotesk + Source Serif 4 + DM Mono, tier-specific color scheme, responsive grid, print styles
¿Listo para discutir una solución similar?
Exploremos cómo la automatización con IA puede ayudar a tu negocio.
Agendar una Consulta